Trends in what goes into a new home should be of interest to all in the home building industry, and a historical perspective may provide a useful basis for sizing up the needs of current buyers and anticipating what lies ahead. The Census Bureau has tracked characteristics of new single-family homes in a consistent way since the mid-1970s. Much has changed since then.
Fundamental characteristics include the size of the home and the lot it sits on. Most of the items considered in this article are based on new single-family homes completed in a given year, but lot size is based on new single-family homes sold, because the Census Bureau only collects information on lots if the homes are built for sale.
Bigger houses, smaller lots
In general, lot size and floor space have trended in opposite directions since 1975 (Figure 1). Median floor space has grown at a relatively consistent rate and without much variation. Median lot size, on the other hand, has fluctuated considerably but is currently considerably lower than it was in 1975.
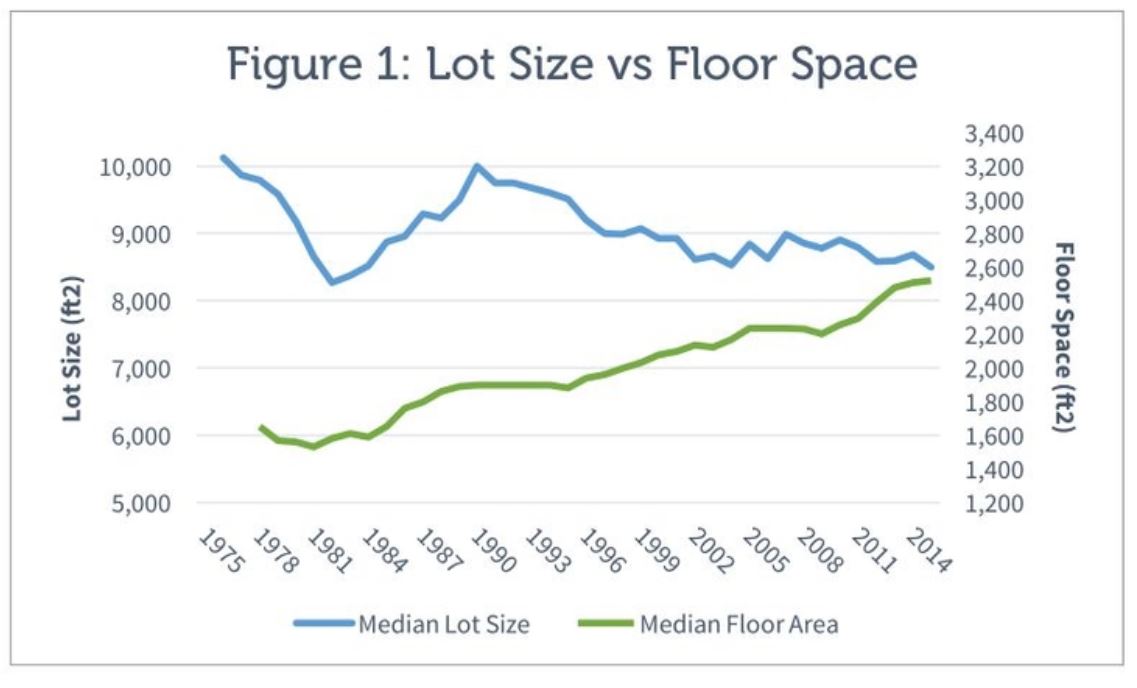
There was a steep decline in the median lot size from 1975 to 1982. This was a period when a global economic recession impacted much of the developed world. The United States experienced high unemployment combined with a high rate of inflation. The sharp decline in lot size correlates with this period of economic turmoil, as the trough of the recession in 1982 corresponds with the lowest median lot size in the graph.
When the overall economy recovered after 1982, the median lot size reversed course and began increasing until 1990. In 1990, the median lot size reached the highest it had been since 1976. After that, the median lot size decreased steadily from 1990 to 2004, even though the overall economy and the housing market was quite strong during much of this period. Since 2004, the median lot size has remained predominantly steady, with relatively minor year-to-year fluctuations.
Figure 2 compares the distribution of lot sizes in 1976 to the distribution in 2015. Only 18 percent of new single-family houses sold in 1976 were built on lots under 7,000 square feet, but by 2015 that percentage had increased to 34 percent. An acre is 43,560 square feet, so 7,000 square feet is about one-sixth of an acre. (For reference, the area of a standard football field between the goal lines covers about 1.1 acre.)
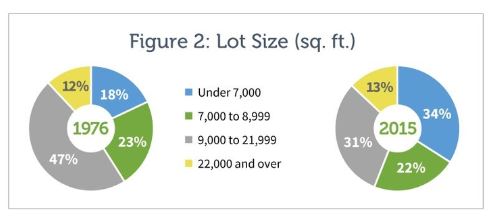
Meanwhile, the percentage of new single-family houses sold that were built on lots in the range of 9,000 to 21,999 square feet decreased from 47 to 31 percent in that same time frame. This range is roughly one-fifth to one-half an acre.
Bathrooms, air conditioning lead list of valued features
Unlike lot size, median floor space has trended upward without any significant instances of deviation. The trend slowed or retreated slightly during recessions. Over the long run, though, the market has tended to favor larger houses.
Although important, size is not the only feature that matters to home buyers. NAHB research has shown that a full bathroom adds more to the value of a home than virtually any other physical feature. So it’s not surprising that the number of bathrooms in new single-family houses has also increased significantly in the last four decades (Figure 3).
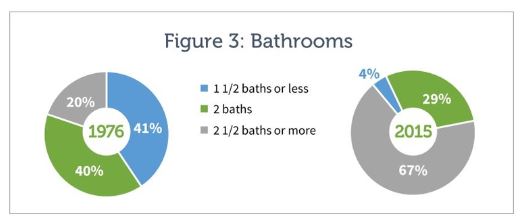
The difference between the distribution of bathrooms in new homes in 2015 versus 1975 is most obvious at the extremes. The percentage of houses with 1 ½ bathrooms or fewer was 41 percent in 1975, and by 2015 that was down to just 4 percent. According to definitions used by the Census Bureau, a full bathroom has a flush toilet, either a bathtub or shower, a sink, and hot and cold piped water. A half bathroom has hot and cold piped water plus either a toilet or bathtub/shower, but not both.
At the opposite end of the spectrum, the percentage of houses with 2 ½ bathrooms or more was 20 percent in 1975, and by 2015 it was 67 percent of houses. Figure 4 gives provides some perspective on how this trend developed over time.
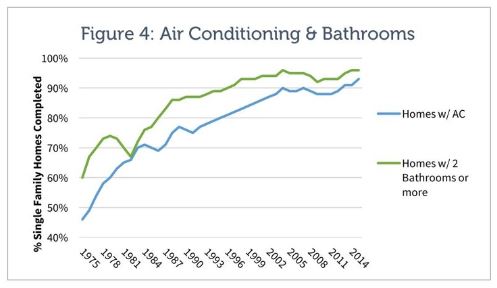
Figure 4 also plots the incidence of air conditioning in new homes over time. As the figure shows, while air conditioning has become largely standard in the modern home, that was not the case in the mid-1970s. According to the census data, only 46 percent of the houses completed in 1975 had AC. Now fast forward to 2015, and 93 percent of new single-family houses have AC.
The majority of the growth occurred between 1975 and 2004, when the share of new single-family homes built with air conditioning first hit 90 percent. Since 2004, the trend has plateaued, and the share of new homes built with air conditioning has hovered around 90 percent, possibly indicating that the market has reached a natural saturation point.
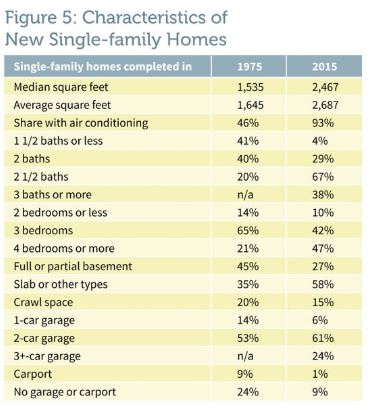
Figure 5 provides a quick snapshot comparing additional characteristics of homes built in 1975 and 2015.
The original article, written by Aaron Ugalde, was published in the Spring 2017 issue of Best in American Living.